
Casey Richter · 1 November 2026
Investigating Energy Consumption Patterns Associated with Cache Operations in Large-Scale Data Centers
Data centers rely on multiple layers of cache memory to reduce latency and improve throughput, yet these components contribute measurable amounts of electricity consumption that operators track closely. Cache operations involve frequent reads and writes between CPU registers, SRAM caches, and DRAM modules, and each access draws power that scales with utilization rates across thousands of servers. Researchers have mapped these patterns by instrumenting hardware counters and power distribution units in facilities operating at hyperscale.
Cache Hierarchy and Its Direct Link to Power Draw
Modern processors incorporate L1, L2, and L3 caches that sit between cores and main memory, and the energy cost per access rises sharply when data must travel farther down the hierarchy. Studies indicate that an L1 cache hit consumes roughly an order of magnitude less energy than a DRAM access, which forces operators to design workloads that maximize locality. In large-scale environments, where servers handle mixed query loads, cache miss rates directly influence both instantaneous power and the subsequent cooling demand required to dissipate heat from memory subsystems.
Measurement Approaches Used in November 2026 Deployments
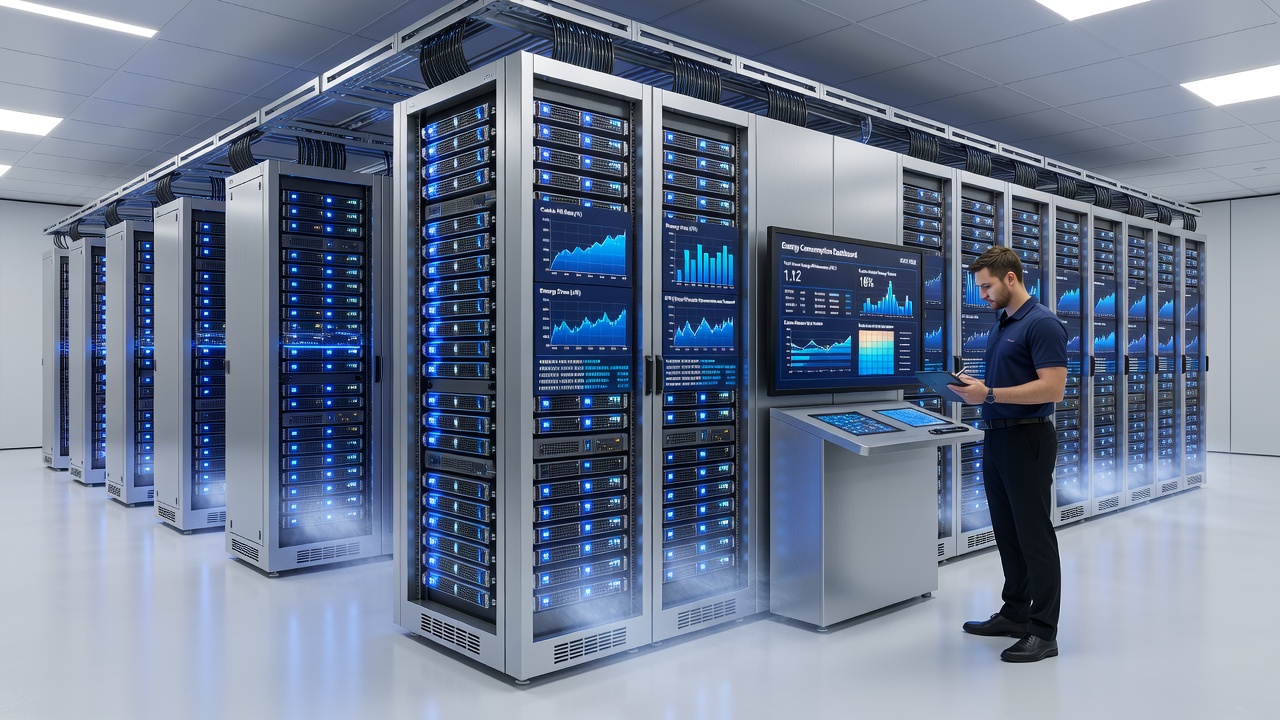
Facility teams began deploying finer-grained sensors on cache-coherent interconnects during 2025, and by November 2026 several operators published aggregated datasets showing daily energy profiles tied to cache activity. These datasets combined RAPL counters from Intel and AMD platforms with rack-level PDUs, revealing that cache-intensive workloads such as in-memory databases could account for up to 18 percent of total server power under sustained load. Observers note that correlating these figures with application-level telemetry allows teams to identify which microservices trigger the highest miss penalties.
Regional Data and Industry Benchmarks
According to the U.S. Department of Energy, data centers in the United States consumed approximately 4 percent of national electricity in recent tallies, with memory subsystems forming a growing share. Parallel reporting from the Australian Renewable Energy Agency highlights similar trends in Asia-Pacific facilities, where cache-heavy analytics pipelines push cooling systems harder during peak trading hours. European Commission energy modeling groups have cross-referenced these numbers with PUE metrics, demonstrating that reductions in cache misses can lower facility-wide consumption without hardware replacement.
Workload Patterns That Shape Consumption Curves
Batch processing jobs often exhibit bursty cache behavior, while streaming services maintain steadier hit rates that keep data resident in L3. Researchers discovered that shifting virtual machine placement to favor NUMA nodes with larger shared caches can trim energy use by several percentage points, because fewer cross-socket transfers occur. Those who analyzed production traces from November 2026 noted that machine learning inference clusters showed distinct evening spikes when model weights were repeatedly loaded from DRAM after cache evictions.
Optimization Techniques Grounded in Observed Data
Operators apply cache partitioning and prefetcher tuning to align access patterns with hardware capabilities, and these adjustments appear in logs as reduced joules per transaction. Data shows that disabling aggressive prefetchers on certain database nodes cut associated power by 7 percent without throughput loss, because unnecessary memory fetches stopped occurring. In parallel, software teams have begun instrumenting applications to report cache statistics alongside traditional metrics, giving facilities teams the visibility needed to correlate code changes with energy outcomes.
Conclusion
Tracking energy tied to cache operations provides concrete levers for efficiency gains in large-scale data centers, and continued sensor deployment through late 2026 has made these patterns more visible than before. Facilities that combine hardware counters with workload scheduling data achieve measurable reductions while maintaining service levels, and the same datasets support future capacity planning across different geographic regions.